11 Years of Real Numbers: My MassMutual Whole Life Illustration vs. Reality
After 11 years, my cash value is about 5% below the illustration.
After about 11 years, my own MassMutual whole life cash value is about 5% below the 2016 illustration, and my death benefit about 1% lower, even though the dividend rate fell from 7.10% to as low as 6.00%.
- The non-guaranteed numbers on an illustration are estimates, not promises.
- From a strong company, real results can land fairly close to the projection.
- Dividends already paid are locked in, so my guaranteed values went up.
- Compare the guaranteed and non-guaranteed columns before you buy.
Not sure whether whole life fits you? It works well for some goals and poorly for others. Tell me your situation and I’ll give you an honest read on where you’d likely land, even if the answer is to wait.
Get my honest readI am an independent broker, so I can sell many companies. This is not a recommendation to buy the same policy. It is a look inside one real whole life policy, so you can see how the guaranteed and non-guaranteed parts behave over time.
The policy: what I bought and why
I first bought whole life in 2009 with Northwestern Mutual. In 2015, at age 29, I moved that policy to MassMutual through a tax-free transfer called a 1035 exchange. About $8,000 of cash value came over. I made the switch for two reasons:
- More coverage. I wanted a larger death benefit while I was young and healthy.
- Better borrowing terms. Whole life lets you borrow against your cash value. With my MassMutual policy, borrowing does not shrink the dividends I earn. I wanted that flexibility for later in life.
Both are strong mutual companies. The move made sense for my plans at the time. It is not a judgment about the old policy.
| Policy detail | My policy |
|---|---|
| Product | MassMutual Whole Life Legacy 65 (premiums end at age 65) |
| Issued | May 2015, age 29, New York |
| Health class | MassMutual’s best health rating, non-tobacco |
| Base whole life | $500,000 |
| Extra term coverage (add-on) | $500,000 |
| Other add-ons | Waiver of premium (covers my premium if I become disabled) |
| What my dividends do | Buy more coverage, which also adds cash value |
| Current annual premium | $6,305 ($5,735 base, $400 term rider, $185 waiver) |
| Loans taken | None |
The design matters. Half my coverage is permanent whole life. The other half is a term rider that is cheap now and gets more expensive later. That blend kept my premium affordable at 29 while I built a permanent base. If you are new to the product, start with our whole life insurance guide.
Why my health class matters to these results
These numbers are based on MassMutual’s best health rating, the price reserved for the healthiest non-smokers. I was 29, a non-smoker, and in good health when I applied.
Health changes the math. For the same death benefit, a person in a lower health class pays a higher premium. That extra premium mostly pays for the higher cost of insuring them, not for more cash value. So each premium dollar buys less growth, and the same policy returns less for someone with an average health rating, and less again for someone with a surcharge (an extra charge for health issues).
| Health rating | What it means for whole life |
|---|---|
| Best health rating | Lowest premium for the coverage. Best return on each premium dollar. |
| Very good health | Slightly higher premium. Slightly lower return. |
| Average health | Higher premium. Noticeably lower return on each dollar. |
| Health surcharge | Highest premium and lowest return. Whole life may not be the best fit. |
That is why I never hand a client my numbers and call it their projection. Your results depend on your age, your health, and which carrier rates you best. Conditions like high blood pressure, high cholesterol, a higher BMI, type 2 diabetes, and sleep apnea can move you between classes, and carriers do not all rate them the same way. Tobacco use has the biggest effect of all.
Whole life illustration vs. actual results
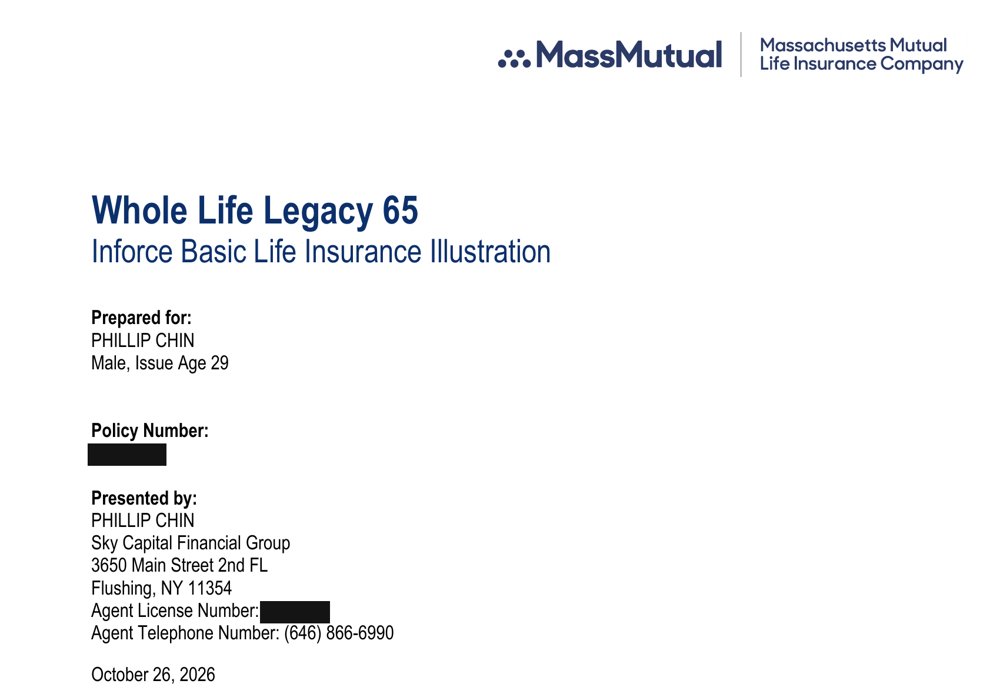
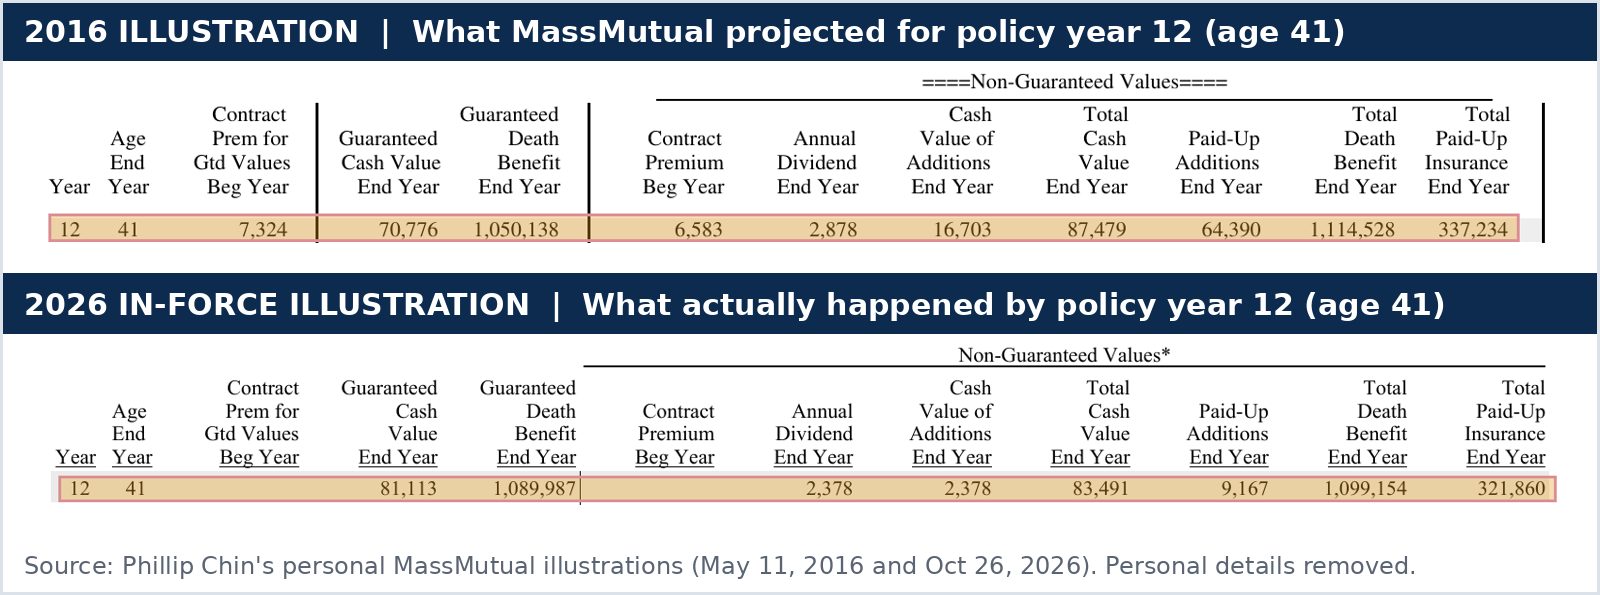
Here is the side-by-side for policy year 12, which ends in May 2027. The 2016 column is what the illustration showed that year, using the 2016 dividend schedule. The 2026 column is the company’s updated report on the same policy, called an in-force illustration.
| Policy year 12 (age 41) | 2016 illustration | 2026 in-force | Difference |
|---|---|---|---|
| Guaranteed cash value | $70,776 | $81,113 | +$10,337 |
| Total cash value | $87,479 | $83,491 | −$3,988 (−4.6%) |
| Total death benefit | $1,114,528 | $1,099,154 | −$15,374 (−1.4%) |
Total cash value at year 12
Source: my own MassMutual illustrations dated May 11, 2016 and October 26, 2026. Values are end of policy year 12.
A 4.6% gap after 11 years, through a long stretch of very low interest rates, is what I mean by relatively close. The illustration itself warns that its values assume today’s dividends continue unchanged, and that “this is not likely to occur.” It did not, and the result still landed near the target.
Why the numbers came in lower: interest rates
Whole life dividends come mostly from how the insurance company invests its money. My illustration says dividends reflect the company’s investment earnings, death claims, and expenses. Life insurers hold large amounts of high-quality bonds. When older bonds mature, the company has to buy new ones at whatever rates the market pays that day.
For most of the years after I bought this policy, those rates were very low. Life insurers’ investment yields had already been sliding for years. One industry analysis showed the average net investment yield falling from 7.02% in 2000 to 4.58% in 2014. No company could keep paying dividends at 2016 levels while reinvesting at lower rates. This was an industry-wide trend, not one company’s problem.
You can see it in MassMutual’s dividend interest rate, the rate it uses to set the investment part of the dividend:
| Dividend year | MassMutual dividend interest rate |
|---|---|
| 2016 | 7.10% |
| 2021 | 6.00% |
| 2025 | 6.40% |
| 2026 | 6.60% |
The 2016 illustration assumed 7.10% would last forever. Instead, the rate fell more than a full point. Even so, my cash value is only about 5% below that projection. The dividend interest rate is not the policy’s rate of return, but the trend explains the gap.
Rates have since moved back up, and MassMutual raised its rate in both 2025 and 2026. 2026 is also the company’s 158th year in a row paying a dividend.
The part most people miss: paid dividends become guaranteed
Here is the part that surprises most people. My guaranteed cash value today is higher than the original guarantee for the same year.
Why? My dividends buy paid-up additions. Those are small chunks of fully paid whole life insurance stacked on top of the base policy. Once a paid-up addition is bought, its cash value and death benefit are guaranteed. My 2026 illustration shows $89,987 of guaranteed paid-up additions.
That means each year a dividend is paid, the floor rises. Future dividends can be higher or lower, but the ones already credited stay. The 2026 illustration also shows the guaranteed cash value at age 65 rising from $300,051 (2016) to $321,785.
Guaranteed floor
Base policy values set in the contract on day one.
Dividends paid
Not guaranteed when projected. Locked in once credited as paid-up additions.
Future dividends
The only part still at risk. This is where illustrations can miss.
What it cost me vs. what it is worth
This is the question everyone asks, so here is the plain math.
| Money in (through policy year 12) | Amount |
|---|---|
| Base whole life premiums (12 × $5,735) | $68,820 |
| Term rider and waiver costs (estimate) | about $6,000 |
| Cash value moved in by 1035 exchange | $8,000 |
| Total in (estimate) | about $83,000 |
| Total cash value, end of year 12 | $83,491 |
Two honest ways to read this:
- Against every dollar I paid, the cash value is about even. But the rider money bought $500,000 of term coverage. That was the cost of protection, not savings.
- Against the whole life dollars only ($68,820 plus the $8,000 exchange), cash value is about $6,700 ahead.
Either way, my family had about $1.1 million of protection for 11 years. The cash value is now growing faster than I pay in. The 2026 illustration shows a non-guaranteed return on new money of about 4.1% next year, rising to about 4.7% by age 49. Those figures assume current dividends continue.
One more honest point. This table starts in 2015. I also paid premiums to my first policy from 2009 to 2015, and only $8,000 came over. Switching a whole life policy usually costs you some of the early-year value. I accepted that for more coverage and the loan design.
What would a policy like this cost you?
My premium reflects my age at issue and a top health class. Yours will be different. Tell me about your health and I will run whole life rates with top-rated carriers, then show you side-by-side illustrations, including what your cash value could look like at 65.
Free, no obligation. No SSN needed to see rates.
Looking ahead to age 65
| At age 65 (year 36) | 2016 illustration | 2026 illustration |
|---|---|---|
| Guaranteed cash value | $300,051 | $321,785 |
| Total cash value | $670,619 | $595,197 |
| Total death benefit | $1,729,569 | $1,591,283 |
The long-range projection fell about 11% because the 2026 illustration starts from today’s lower dividend rate and compounds it over 24 more years. If rates keep improving, that number can move back up. If they fall, it can drop. That is why I review a policy every few years instead of treating one illustration as the final word.
Whole life is a hedge, not a replacement for the market
I do not own whole life to beat the stock market. Over long periods, stocks have historically offered more growth, with bigger ups and downs. Whole life does a different job:
- It does not drop when the market drops. Cash value that has been credited does not go down because stocks fell.
- It gives you money you can reach in a bad year. You can borrow against cash value instead of selling investments when prices are low.
- It pays a death benefit no matter what the market does.
Think of it as the steady part of a plan. It lets the rest of your money take normal market risk with less worry. Some people later draw on cash value in retirement. See how life insurance can support retirement income.
What matters most: a good policy from a strong company
The non-guaranteed values drive real-world results, so the company behind them matters more than any single illustration. When I compare whole life for clients, I look at:
- Dividend history. How long the company has paid dividends, and how its dividend rate held up when interest rates fell.
- Financial strength. Ratings from firms such as AM Best.
- Mutual ownership. Mutual companies are owned by their policyowners, not stockholders, so profits can flow back as dividends.
- Policy design. How much goes to base premium vs. paid-up additions, which riders you carry, and how loans work.
Two illustrations can look alike in year one and drift apart over 20 years. Judge the company’s track record, not just the projection.
How to read your own whole life illustration
- Know what each column means. The guaranteed column is the contract’s worst case, where the company never pays another dividend. The non-guaranteed column is the realistic planning number. Expect real results to land within a reasonable margin of it.
- Find the dividend schedule year. It is printed in the fine print. That is the assumption behind every non-guaranteed number.
- Ask for a lower-dividend illustration. It is a useful stress test that shows what happens if rates fall again.
- Separate the riders. Know how much of your premium buys term coverage and how much builds cash value.
- Ask how borrowing works. Find out what interest you would pay and whether a loan lowers your dividends.
- Request an in-force illustration every few years. Compare it to the original, like I did here.
If you are deciding between products, our term vs. whole life comparison covers who each one fits. If you have term coverage with a conversion right, see how term conversion works.
Have this ready to review your own policy
- Your original illustration from when you bought the policy
- A current in-force illustration from the company
- Your annual statements showing dividends paid
- How you take dividends: paid-up additions, cash, or premium reduction
Common mistakes I see with whole life
- Planning around the guaranteed column. It assumes the company never pays another dividend. For a company with a long dividend history, that is not a realistic planning case. Plan around the projection, with a margin for error.
- Comparing whole life to the stock market. They do different jobs. Whole life is the stable part of a plan, not the growth engine.
- Buying more premium than you can keep. Whole life rewards people who pay for decades. Dropping it early is where most of the cost hides.
- Replacing a policy without a side-by-side review. A switch restarts the early years and the two-year contestability period. It can make sense, but only with the numbers in front of you.
- Ignoring rider costs. Term riders and add-ons can raise your premium over time.
- Never checking in. Most owners never ask for an in-force illustration. It is free and takes one phone call.
Whole life is not right for everyone. If your need is temporary, such as a mortgage or kids at home, term coverage usually does the job for far less. Whole life fits best when you want coverage for life, can pay comfortably for many years, and value guarantees. See why an independent broker can help you compare.
How to see your own whole life numbers
- Tell me about your health. The personalized rate form takes a few minutes and asks what underwriters actually look at.
- I check which carriers fit you. I look at how each one is likely to rate your health before you apply, so you are not guessing.
- You get side-by-side illustrations. Premium, guaranteed and non-guaranteed values, and what the policy could look like at 65.
- You decide. No pressure and no broker fee.
Not sure you need whole life at all? Start with how much life insurance you need or the life insurance calculator. Many families start with term and add a smaller whole life policy later. For add-ons worth knowing, see the best life insurance riders.
Whole life policy performance FAQ
Does whole life insurance perform as illustrated?
Not exactly, but it can come close. The guaranteed values are the contract’s minimum. The non-guaranteed values depend on future dividends, which change with interest rates. My policy came in about 5% below its 2016 illustration at year 12, even though the dividend interest rate fell more than a full point.
Are whole life dividends guaranteed?
No. Dividends are not guaranteed and can go up or down. But when dividends buy paid-up additions, the additions themselves become guaranteed once they are credited.
What is a paid-up addition?
A paid-up addition is a small amount of fully paid whole life insurance bought with your dividend. It has its own cash value and death benefit, it earns future dividends, and it never needs another premium.
What is an in-force illustration?
An in-force illustration is an updated projection for a policy you already own. It uses your actual policy values and the current dividend schedule. You can request one from your insurer or agent.
What is a 1035 exchange?
A 1035 exchange lets you move one life insurance policy into another without paying income tax on the gain, under Section 1035 of the tax code. It does not avoid the other costs of switching, such as restarting early-year values and contestability.
Can I borrow from a whole life policy?
Yes. Once you build cash value, you can borrow against it without a credit check. You pay interest on the loan, and any unpaid loan is subtracted from the death benefit. Some companies also lower your dividends while you have a loan, so ask how borrowing works before you buy.
Does my health affect whole life returns?
Yes. A lower health class means a higher premium for the same coverage, and most of that extra cost goes to insurance, not cash value. The same policy usually returns less for someone with an average health rating than for someone with the best rating.
Is whole life insurance worth it?
It can be if you want lifelong coverage, can pay steadily for many years, and want a stable asset that does not move with the stock market. It is a hedge, not a replacement for investing. If you only need protection for a set number of years, term is usually the better buy.
Sources
- MassMutual. MassMutual 2026 policyowner dividend announcement (2026 dividend interest rate and dividend history).
- NAIC. Life insurance illustrations (basic vs. in-force illustrations, guaranteed vs. non-guaranteed elements).
- FINRA. Should you exchange your life insurance policy? (costs of replacing a policy, new contestability period).
- Cornell Law School LII. 26 U.S. Code § 1035 (tax-free exchange of life insurance contracts).
- MassMutual via InsuranceNewsNet. MassMutual 2016 dividend announcement (7.10% dividend interest rate for 2016) and 2021 dividend announcement (6.00% for 2021).
- Society of Actuaries, The Actuary. Life insurer investment yields in a low-rate environment (industry net investment yield, 2000 to 2014).
The bottom line
After 11 years, my whole life policy landed about 5% below its first illustration, through a decade of falling interest rates. That is what I mean when I say the projection is not exact, but relatively close. Buy a well-designed policy from a strong company, review it every few years, and use it as a hedge alongside your investments, not instead of them.
If you own a whole life policy and have never seen an in-force illustration, I can help you request one and read it, at no fee. You can ask for a free policy review or compare carriers for new coverage.
Not sure how much coverage you need? Try the free Life Insurance Calculator →

Licensed Insurance Broker · Licensed since 2008 · NPN #8895251
Independent broker comparing 25+ carriers. Educational information only, not financial advice.